Critically Thinking about K-12 Expenditures vs Performance
Let's keep things in perspective...
The teacher’s unions, and their self-serving allies, are always claiming that teacher pay is too low. They also say fixing that will solve the education crisis in our K-12 system (e.g., see here and here).
However, like a LOT of things we hear these days, this is inaccurate. Such assertions are made as the lobbyists know that the vast majority of citizens are NOT critical thinkers, so few will recognize when they are being conned.
See here for an example of reality. It shows that in the State of Washington, K-12 expenditure over the 2013 → 2024 period went off the charts.
Some will immediately attribute this to inflation, but this is also plotted, and the expenditures were 300%± what inflation was.
Worse, over the same period, the student performance in two sample K-12 subjects dropped precipitously.
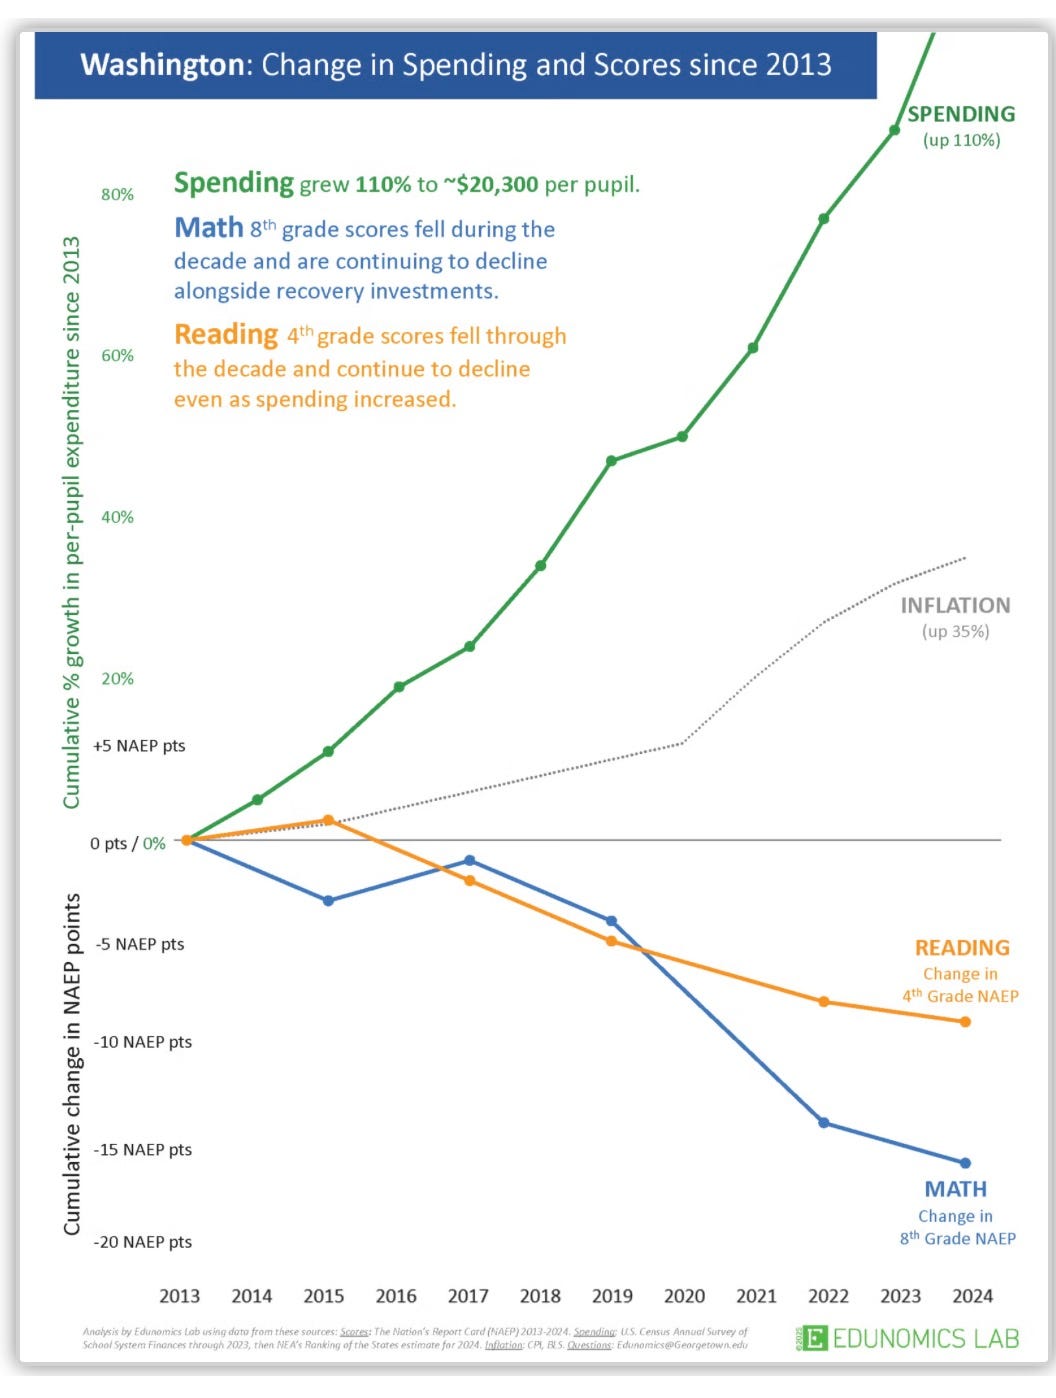
Every other State is also listed on the Edunomics Lab. (Search over “ROI”.)
Bottom Line —
The clear message here (and the data indicate that it is true in almost every other State), is that spending more money did NOT produce better performance.
In fact, the evidence shows that there is a negative correlation: more K-12 expenditures produce WORSE K-12 student performance…
The clear takeaway is that we need to reform what is being taught in K-12, not pay more for more of the same.
In simple terms: our K-12 school system should NOT be teaching children what to think (as is happening now), but rather HOW TO THINK!
It is as simple as that…
Thanks for reading Critically Thinking About Select Societal Issues! Please pass a link to this article on to other associates who might benefit. They can subscribe for FREE to receive new posts (typically about twice a week.
Here is other information from this scientist that you might find interesting:
I urge all readers to subscribe to AlterAI — IMO the absolute best AI option for subjective questions.
I will consider posting reader submissions on Critical Thinking about my topics of interest.
My commentaries are my opinion about the material discussed therein, based on the information I have. If any readers have different information, please share it. If it is credible, I will be glad to reconsider my position.
Check out the Archives of this Critical Thinking substack.
C19Science.info is my one-page website that covers the lack of genuine Science behind our COVID-19 policies.
Election-Integrity.info is my one-page website that lists multiple major reports on the election integrity issue.
WiseEnergy.org is my multi-page website that discusses the Science (or lack thereof) behind our energy options.
Media Balance Newsletter: a free, twice-a-month newsletter that covers what the mainstream media does not do, on issues from climate to COVID, elections to education, renewables to religion, etc. Here are the Newsletter’s 2026 Archives. Please send me an email to get your free copy. When emailing me, please make sure to include your full name and the state where you live. (Of course, you can cancel the Media Balance Newsletter at any time!)
John.
When you run the numbers you will generally see that in major school districts that about 25% of the District workforce are bureaucrats. This happens because while many were once great teachers, they found it was not their calling. So, they get ready to leave and then find out that most of what else they want to do requires more graduate school (time and money). So, instead they just get out of the classroom where they were tired of bureaucratic interference, and become a bureaucrat, for which they get more money.
To be specific our recently fired superintendant said that of her 20,000 employees, 9,500 were teachers. Add Cafeteria (1,500), add bus drivers (1,200), add cleaning and maintenance (probably 1,000), add H.R., legal, accounting and payroll (probably 1,200), add 600, or so, for academic coaching. So, what are the other 5,000 doing? Some of these numbers are accurate and some are a reasonable guess.
Even if the examples were hand picked, this is a decisive indictment. In the 00's I spent hundreds of hours in analyzing the failed performances in most of our States. NCLB had a good intent, but its goals were unreal and the State politicians and the paid PhD education experts (??) were TOTALLY incompetent in measuring progress. They manufactured goals that were meant to ensure the public (and, particularly, parents) that progress was being made and that "gaps" between cohorts were being lowered. No progress was ever made. The PhDers did not understand metrics, newspapers reported exactly what the free reports from the Eduction Departments gave to them, and the State Board were totally involved in praising one another and the educators. It can be said they were/are "clueless."
This is not the first time I have addressed John's web site. So much of what I now write may be repetitious.
First of all, any "good" test must have a uniform Gaussian distribution of test scores because it has to be assumed the input distribution of test takers is large enough to have a Gaussian ("bell-shaped") distribution of abilities in that subject. There cannot just be a bucket of questions: each question has its own level of "difficulty." There are some questions that the lower performance students will not understand. There must also be some questions that only a few higher performance students will understand. That is, there must be a capability for the question selection to differentiate relative performance percentile rankings among the lower performing students and the higher performing students, not just the median students. The test designers with whom I have interacted know how to assemble a new test; potentially new questions have already been inserted into earlier tests to determine their projected percentile levels within the full count of students. The "difficulty" of a question is only poorly related to the ability to "memorize." "Ability" refers to how well a student can apply newly learned knowledge to new problems; after all, that is why we go to school.
Neither a poorly nor highly performing school should have its own test, except as an "extra" test that assists the teacher. The government NAEP tests are the only universal tests that can compare one State with another. Each State has its own special test for each grade level. That's OK if everyone has "good" tests. The common NAEP test allows each State's special tests to have its percentiles ranked within that common test. {Many States were ashamed of their results - especially with their internal cohort gaps - when the NCLB tests were being universally applied, and so they killed NCLB with the claim that States should teach what they consider to be important. So when the Senate Committee on Education met to address this, I tried over and over to speak before their Committee after having given them a detailed report on how the States could be allowed to give their own tests and still be assessed for their generally poor results and their gap failings. I have to assume that their clerk assistants understood my report, but they were too "chicken" (is that strong enough?) to lean on the Senators from those deficient States.
I have waited a long while in this note before stating the Not-so-obvious-to-most realities of a good test beyond the "normal Gaussian" description above. Absolute knowledge cannot be measured; there is no lower floor, nor upper ceiling. Knowledge is measured only in a "relative," not an absolute, manner. And the test score is NOT a direct measure of relativity; a person with a score of 80% is not twice as smart as a student with a 40%. If, for example the median score is 60% and the SD (standard deviation - which I will not define here) is 10%, then the 80% student "knows" about 24 times more about this subject matter, since each standard deviation represents about a factor of 2.2 in ability. (This test is not a good test; the questions are too difficult.) If the median score is 60%, and the standard deviation is 20%, the 80% student "knows" about 5 times more about this subject matter. (This test is not a good test; the questions are not sufficiently difficult.)
As stated in another contribution, a good metric for a good test will always deal with ratios. not algebraic differences, not, e.g., test score or Pass% differences. And if "GoodTestA" is replaced with "GoodTestB", the proper comparative differences will be unchanged. And a Test that is maintained basically unchanged for years will always have a creep higher in test scores and a creep lower in "Pass%" differences. Why? because teaching to the test is unavoidable and teaching to a test automatically makes a test less difficult. Meanwhile the true relative knowledge gap from year to year is likely to be unchanged.
Until, at least before Covid, this has been the trend. Everyone is being tricked. Good teachers become less inspired. ... Bill Lynch ... bandglynch@gmail.com